
Why it Works?
Reasons to engage
with the future ...
Real-Time Portfolio Transparency
Our unique approach to Real-Time Portfolio Transparency enables users to verify at any moment the transparent association of GEM DiCom with real assets within the managed portfolio.
It boosts transparency, fosters market confidence, and supports clear operational distinctions from stablecoins.
As an interested person or a participant, you have several avenues to verify the associated portfolio, being on-chain, off-chain, or visually. This is our commitment to transparency.
And honestly, we do not know, why we are – as far as we know, the leading market participant that offers this in such full detail and depth.
Market Volatility & Resilience
The concept of "drawdown" is a measure of the largest observed loss from a peak to a trough in the value of an investment before it recovers to a new peak. It is expressed as a percentage and helps assess downside risk over a specific period.
GEM's historical market performance, showing a maximum drawdown of 1.88% in the period 2011 to 2024, reflects its market dynamics.
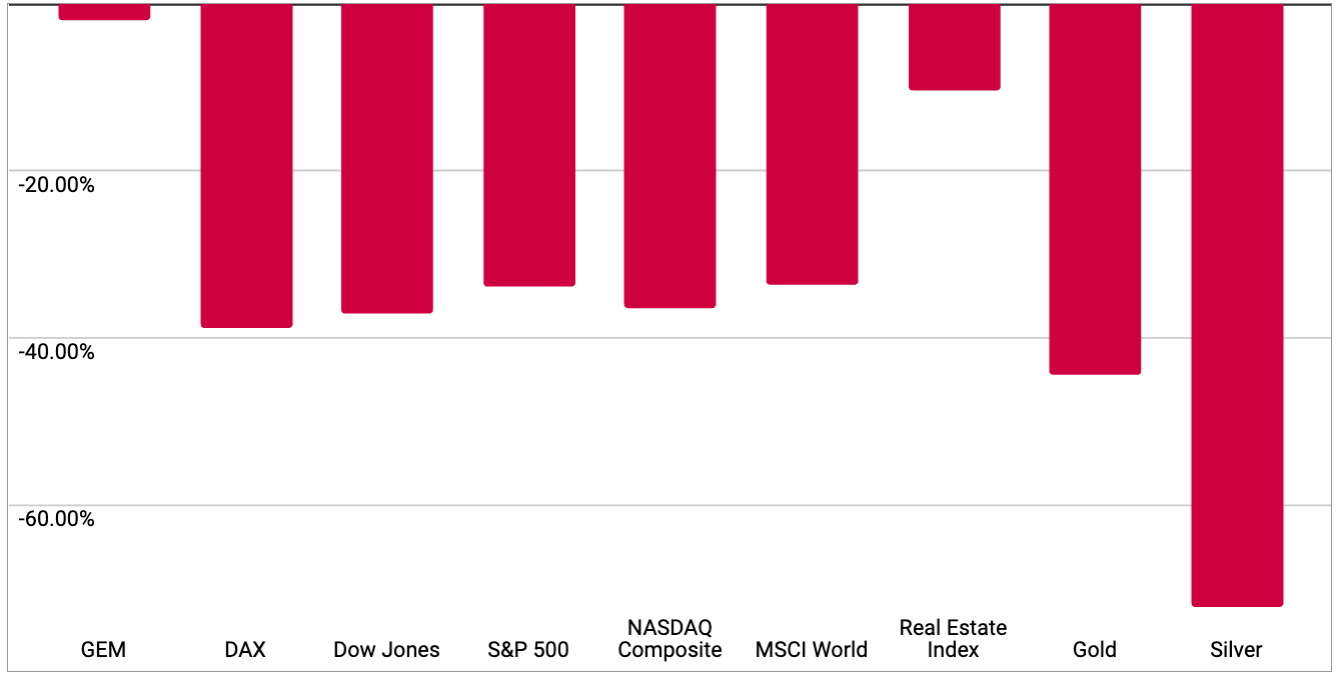
If you put the return into relation to the maximum drawdown, you get a ratio that helps assess how risky an investment is. This ratio is called Calmar Ratio. The higher the Calmar Ratio the better the risk-adjusted performance. This ratio shows how much return is achieved per unit of downside risk.

With a Calmar Ratio of 56.88 GEM is remarkably positioned when it comes to market-based performance insights.
Because transparent market dynamics provide clear insights, you don't necessarily need market timing for GEM. The right time to engage is ALWAYS NOW and it's ALWAYS OPTIMAL. Tell that to the guy who invested in gold in July 2011 and was still in the red in December 2015.
BUT: As always, the results of the past are not a guarantee for the same results in the future. The future development might be totally different. See also our Disclaimers.
Market Insights
Having a low Maximal Drawdown often correlates with less return. Interestingly, historical data for this asset class suggests a different pattern.
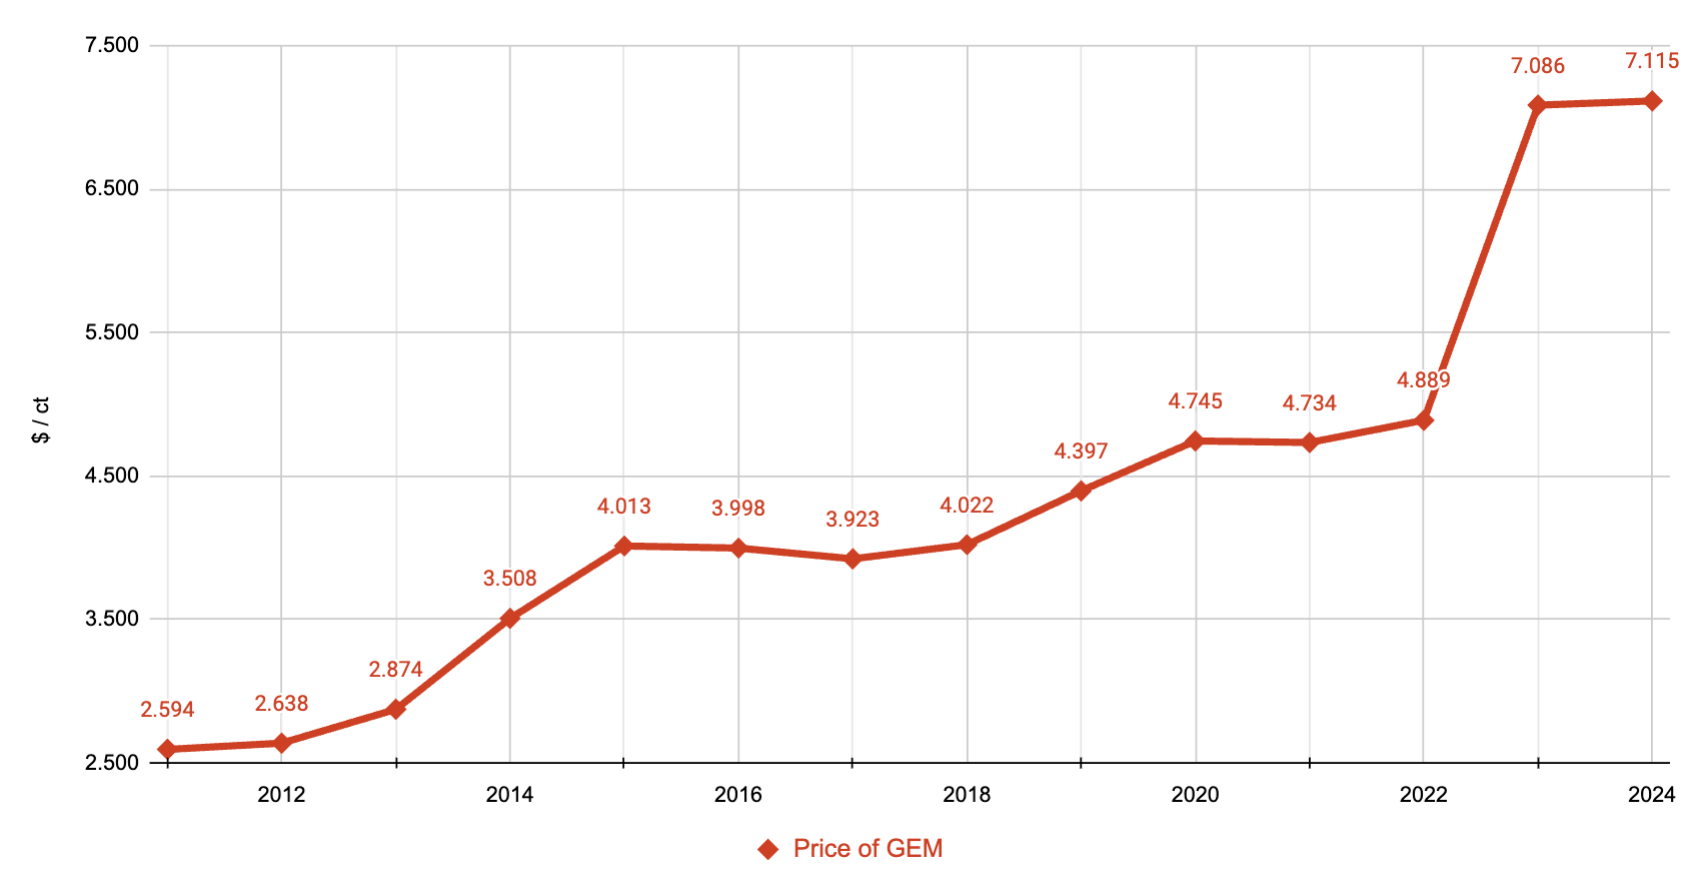
The portfolio of 12 investment-grade colored gemstones, which transparently influences GEM DiCom's market value, has shown an increase from $2,594 per carat in 2011 to $7,115 per carat in 2024. This translates to a historical annual increase of approximately 12.5% for the physical gemstones. This portfolio's performance provides insights into the market dynamics influencing GEM DiCom. Therefore, based on this historical data for the gemstone portfolio, GEM's market-driven price has evolved from an equivalent of $2,594 in 2011 to $7,115 in 2024.
BUT: As always, the results of the past are not a guarantee for the same results in the future. The future development might be totally different. See also our Disclaimers.
Democratized Access
Traditionally, gemstone investing has always been reserved for the noble [1] and wealthy. A single investment-grade gemstone typically starts at $15,000, with most stones costing far more. This high entry barrier – combined with the need for expert knowledge, secure storage, and access to exclusive dealer networks – has made the gemstone market challenging to access for most people.
With GEM DiCom, that changes. Through Digital Melting, GEMtrust allows anyone to engage with a well-diversified portfolio of twelve high-quality, investment-grade colored gemstones [2] starting from as little as $1.
This means that for the first time in history, the unique characteristics of gemstones (including historical resilience and long-term market influence) are no longer limited to high-net-worth individuals or noble families.
We are opening up a whole new asset class – one that was historically closed off – and making it transparently accessible to everyone.
_______
[1] “Gemstone” means “Edelstein” in German, with “edel” being the German word for “noble”. So in German, “gemstones” literally means “stones of the noble”.
[2] Due to this, the already low volatility and downside risk of gemstones is further reduced, which explains the low maximum drawdown of this selected portfolio.
GEMtrust DAO LLC
office@gemtrust.net

Copyright © GEMtrust DAO LLC - All Rights Reserved